
TRENDS IN NUTRIENT LOADS FROM
THE DANUBE RIVER AND TROPHIC
STATUS OF THE BLACK SEA*
September 2006
*Extended version of a briefing note originally provided
to GEF Council on 6 June 2006
Joint Report of the GEF-UNDP Black Sea Ecosystem
Recovery Project and the GEF-UNDP Danube Regional
Project
Table of contents
Summary - the story to date ..............................................................................1
1. Introduction..................................................................................................4
2. Nutrient concentrations in the Danube River............................................4
3. Danube loads to the Black Sea...................................................................6
4. Danube flow/concentration relationships..................................................9
5. Nutrient concentrations in NW Shelf waters ...........................................11
6. Phytoplankton populations in NW Shelf waters .....................................12
6.1
Abundance and biomass .............................................................................. 13
6.2
Community composition................................................................................ 13
6.3
Chlorophyll-like substances.......................................................................... 14
7. Zooplankton ...............................................................................................17
8. Zoobenthos populations of the NW Shelf................................................17
8.1
Abundance and biomass .............................................................................. 18
8.2
Species diversity ............................................................................................ 18
8.3
Zoobenthos indices........................................................................................ 18
9. Dissolved oxygen status of NW Shelf waters .........................................20
10. Discussion..................................................................................................22
10.1 Nutrient loads and levels............................................................................... 22
10.2 Ecology, organic carbon and oxygen balance........................................... 22
Table of figures
Figure 2.1. Trends in nutrient concentrations (inorganic N and total
5
P) in the Danube River (2000-2003)
Figure 2.2. Nutrient and BOD5 content of livestock manure in the
5
Black Sea sub-basins of Romania and Bulgaria (1960-
2003)
Figure 3.1. Danube River annual nutrient/BOD5 loads and flows to
6
the Black Sea (1996-2005)
Figure 3.2.
Inorganic nitrogen load/temperature relationships at Reni
7
during 1996-1998 and 2003-2005
Figure 3.3.
Inorganic nitrogen load/temperature relationships at Reni
7
during 1996-1998 and 2003-2005
Figure 3.4.
Inorganic nitrogen loads at Reni (1996-2005), accounting
8
for flow and temperature
Figure 3.5.
Total phosphorus load/instantaneous flow relationships
8
at Reni during 1996-1998 and 2003-2005
Figure 3.6.
Total phosphorus loads at Reni (1996-2005), accounting
8
for flow
i
Figure 3.7. Danube River annual nutrient loads and flows to the
9
Black Sea (1988-2005)
Figure 3.8.
River Danube annual inorganic nitrogen land total
9
phosphorus oads (corrected for annual discharge) to the
Black Sea (1989-2005)
Figure 4.1. Time series of nutrient and BOD5 concentrations at Reni
10
(2000-2005)
Figure 4.2. Danube flow-concentration relationships for nutrients
11
and BOD5 at Reni (2000-2005)
Figure 5.1. Annual average nutrient concentrations in Black Sea
12
surface waters near Constanta, Romania (1975-2005)
Figure 5.2. Amalgamated nutrient concentration data from the
12
Romanian part of the Black Sea (1990-2004)
Figure 6.1. Phytoplankton cell density and biomass (average annual
13
data) offshore of Constanta, Romania (1983-2005)
Figure 6.2.
Long-term (1960s-2000s) average phytoplankton
13
biomass in the Black Sea: (A) annual average data
offshore of Constanta, Romania and (B) annual
September values three nautical miles offshore of Cape
Galata, Bulgaria
Figure 6.3.
Phytoplankton community composition near Constanta,
14
Romania (1986-2005)
Figure 6.4.
Chlorophyll-like substances in the Black Sea (1997-2005)
15
Figure 7.1.
Long-term summer abundance of Cladocera and
17
Copepoda three nautical miles offshore of Cape Galata,
Bulgaria (1967-2005)
Figure 8.1
Macrozoobenthic species distribution in the NW Shelf
19
(2003)
Figure 8.2.
Number of macrozoobenthos species near Constanta,
19
Romania (1960s-2003)
Figure 8.3.
AZTI marine biotic index results - geographic
20
distribution (2003)
Figure 9.1.
Dissolved oxygen content of Romanian coastal waters
21
(1996-2004)
ii
Summary - the story to date
This briefing note brings together available data on trends in Danube River flows,
concentrations and loads to the Black Sea, in addition to an assessment of the Sea itself,
concentrating on the NW shelf where the Danube discharges. The available data are
complex, open to a range of interpretations and sometimes even contradictory1, but the
overall picture that emerges is one of a situation that is beginning to improve:
· While the emphasis of the DRP and BSERP projects has been (and remains) on
nutrient source reduction, some of the best indicators of the trophic status of the
receiving waterbody (the Black Sea and, more specifically, the North West Shelf)
are at least as closely allied to organic enrichment as they are to nutrient
enrichment (Sections 7 and 8). Further emphasis on reducing organic loading to
the Danube and the Black Sea could, therefore, contribute to improvements in the
ecological status of the Black Sea. However, no studies are known to have been
undertaken comparing the importance of riverine and coastal anthropogenic
organic carbon discharges with organic loads produced by primary production in
shallow, coastal waters.
· River loads of nitrogen and phosphorus increase with the river discharge (Figs.
3.3 and 3.5). The large variability in annual flow rates makes it difficult to
undertake statistics on short time-series of loads. The increasing trend of the
annual water volume during the past 15 years may (partly) obscure any river load
trends as a result of anthropogenic emissions (e.g. Figs. 3.2 and 3.3). Also, even
after excluding statistical "fliers" the error margin in measured nutrient
concentrations is in the region of 10-20%, a fact which may obscure (weak)
trends.
· Short-term nutrient concentration data (2000-2003) show an improving trend (i.e.
concentrations are decreasing) in the upper and middle reaches of the Danube
(Fig. 2.1). More recent (2003-2005) data suggests that this improvement is now
being reflected in reducing nitrate loads to the Black Sea (Section 3, Fig. 3.4).
· In absolute terms, there appears to have been a trend of decreasing total
phosphorus and increasing inorganic nitrogen loads between 1988 and 2005 (Fig.
3.2). However, when the trend of increasing river flow is accounted for, there is
actually a marginal decrease in inorganic nitrogen loads and a much more
substantial decrease in total phosphorus loads (Fig. 3.8). While annual flow-
corrected data over the period 1996-2001 suggest no real improvement in
inorganic N (Fig 3.4) or total P (Fig. 3.6) loads, instantaneous flow/concentration
1 For example, inorganic nitrogen loads measured at Reni as part of the Trans National Monitoring
Network (TNMN) are not consistent with data collected at Sulina (one of the three main branches of the
Danube discharging into the Sea) by the Romanian National Institute for Marine Research and
Development (NIMRD). A seven-fold decrease in the inorganic nitrogen load over a ten year period
(NIMRD data, not shown) is considered to have been extremely unlikely, and therefore the TNMN data
have been used as the basis for assessing load inputs via the Danube in this note.
1
plots (Figs. 3.3 and 3.5) indicate that progress is still being made. The large
increase in annual total phosphorus load during 2005 can be explained by the high
flows during that year (Figs 3.7 and 3.8).
· To date, the emphasis on nutrient control has focused primarily on point source
reduction. The benefits of capital investment in nutrient-stripping technology to
date have been rather small, and there is an apparent need to re-focus attention on
diffuse sources. However, the benefits of major reductions in livestock numbers
and inorganic fertilizer usage since 1988 (e.g. Fig. 2.2) almost certainly have not
yet been fully realized. When they are (and agriculture-derived nutrient loads fall
substantially), capital investment in waste water treatment plants will become
progressively more important.
· The longer-term trends in inorganic nitrogen loads, while initially appearing to be
disappointing, should be taken in context, since recent (2003-2005) data suggest
that real improvements are beginning to occur upstream (Fig. 2.1). There is a
widely acknowledged lag phase for nutrient source reduction being reflected in
reduced river concentrations and loads. There are two main reasons for this: (i) for
diffuse sources-derived nutrients, the time taken to flush historically accumulated
nutrients from soils and groundwaters to surface waters (ii) internal loading in
waterbodies (in this case referring to both the Danube and the Black Sea) from
historically-enriched sediments until new sediment-water equilibria can be
established.
· The reducing nutrient concentrations (2000-2003; Fig. 2.1) in upper and middle
reaches of the Danube suggest that this lag period may be nearing an end, a
hypothesis supported by 2003-2005 nitrate data from Reni (Fig. 3.4). The pattern
of improvements being shown first in upstream sections of the river is fully
consistent with what would be expected as the lag phase begins to end.
· Nutrient data for a coastal water site near to Constanta showed a decrease in
nitrate levels during the late 1970s, which has been maintained since (albeit with
2005 being a year of unexpectedly high concentrations, corresponding to
relatively high flows in the Danube River). Phosphate levels at the same site
showed a substantial fall during the early-mid 1990s, with a lower level being
maintained since the late 1990s (Fig. 5.1).
· The situation and trends (since 1990) in nutrient levels throughout the NW Shelf
as a whole remains unclear because of the paucity of available data, perhaps the
fairest interpretation of which is either an increase or no change in nutrient
concentrations (full data not shown). Amalgamated marine average annual
nutrient concentrations show wide variability, so timescale is critical when
assessing trends. The inclusion or exclusion of a couple of years of annual
average values could dramatically change this assessment. However, for the
Romanian part of the NW Shelf, while nitrate concentrations show an increasing
trend (1990-2004), phosphate levels have shown a decreasing trend (Fig. 5.2).
2
· Despite data suggesting that the nutrient status of the NW Shelf has not yet
improved substantially, and may even have worsened at some sites during the last
15 years, there is clear and compelling evidence of improving biological status
(Sections.6 and 7). Causes underlying this biological recovery are not fully
understood, but the most likely influencing factors are: (i) climate change; (ii)
over-fishing; and (iii) the invasive combjelly Mnemiopsis leydyi, a planktonic
organism that first appeared in the Black Sea in the early 1980s. Mnemiopsis
feeds "actively" on zooplankton and fish larvae, but only "passively" on
phytoplankton.
· Climate change could be a contributory factor in increasing nutrient
concentrations in the Black Sea, with internal loading of nutrients in the NW
Shelf appearing to be linked to wind speed, direction and duration. This may be a
direct effect of physical mixing at the sediment-water interface and/or a indirect
effect caused through changes to the dissolved oxygen status of shallow benthic
areas: at higher dissolved oxygen levels less phosphate is released from
sediments, nitrification is promoted and dentrification is inhibited. Further work
on sediment-water nutrient exchange is planned as part of the final BSERP cruise.
· Over-fishing may have resulted in decreased grazing pressure on zooplankton
and, therefore, increased grazing pressure on phytoplankton. However, available
historical commercial fishing data for the Black Sea Region are (in general terms)
sparse and incomparable. BSERP has funded a number of workshops and studies
on fish stock assessment methodologies to promote regional harmonization in the
future, but these will not help re-build historical datasets.
· Phytoplankton results strongly suggest an improving situation throughout the
1990s, and continuing improvements since then (Figs. 6.1-6.3). This conclusion is
supported by remote sensing data of chlorophyll-like substances, available since
the late 1990s (Fig. 6.4).
· The Danube continues to have an impact on zoobenthos populations just offshore
of the delta, but further north the Dniester River is almost certainly an additional
cause of disturbance to zoobenthos communities (Figs. 8.1 and 8.3). However,
zoobenthos biodiversity nears to Constanta has increased greatly since the late
1980s, suggesting that the impact of the Danube has reduced greatly (Fig. 8.2).
· Dissolved oxygen concentrations in the 1970s showed a huge deterioration in
environmental conditions/trophic status of the NW shelf in the 1970s and early
1980s. However, by the mid 1990s substantial improvements had been recorded
(Fig. 8.1). The overall situation appears to have improved further since then,
albeit with a temporary return to eutrophic conditions in 2001. A further return of
hypoxic conditions was also reported off the coast of Constanta (Romainia) and in
the Ukrainian part of the NW Shelf during 2005, but the extent and severity of
this event remains unclear (Section 8).
3
1. Introduction
During the 1970s and 1980s, the trophic status of the Black Sea, and particularly the NW
Shelf increased dramatically, resulting in extended and extensive periods of hypoxia,
with severely damaged pelagic (water column) and benthic (sediment) ecosystems. The
following short- and long-term nutrient-related targets have been agreed upon for the
recovery of the Sea:
Short-term:
to avoid exceeding loads of nutrients discharged into the Sea beyond
those that existed in 1997.
Long-term:
to reduce the loads of nutrients discharged to levels allowing Black Sea
ecosystems to recover to conditions similar to those of the 1960s.
Trophic status is determined by nutrient and organic loads/concentrations. Organic matter
in the Sea can be derived from external sources (River flows and discharges from land) or
can be generated within the sea itself via photosynthesis, predominantly by
phytoplankton, the growth of which are stimulated by elevated nutrient concentrations.
Thus, both nutrient and organic loads/concentrations need to be considered in assessing
the recovery of Black Sea ecosystems.
This briefing note provides information on indicators of Black Sea recovery, focusing on
the NW Shelf, and nutrient/organic discharges via the River Danube.
2.
Nutrient concentrations in the Danube River
Between 2000 and 2003, nutrient concentrations in the middle and upper reaches of the
River Danube showed a decreasing trend (Fig, 2.1). However at the two most
downstream sites, nutrient concentrations either showed no discernable trend or an
increase. Reasons for the difference in trends between the four most upstream sites and
two downstream sites remain unclear but must be linked to nutrient inputs from
Bulgaria/Romania, the effect of the Iron Gates Reservoirs (formed by dams across the
Danube River) and/or the release of nutrients from sediment in the lower Danube River
itself.
In the upstream reaches (above the Serbia and Montenegro/Hungary border), using
Dablas data on nutrient reduction loads generated from capital investment in Sewage
Treatment Works and comparing these with instream loads, the resultant maximum
reduction is only of the order of 7% for phosphorus and 2% for nitrogen. This suggests
that even with the huge capital investments to date, and further potential capital
investments in point source nutrient reduction in the future, little progress is likely to be
made unless inputs from diffuse sources can be effectively tackled.
However, having said this, nutrient (and organic carbon) loads from livestock (cattle,
pigs, poultry, sheep and goats) have decreased massively in many Danube/Black Sea
countries since the economic collapse of the late 1980s/early 1990s (e.g. Fig. 2.2).
Likewise, huge reductions in the use of inorganic fertilisers have also occurred (data not
shown).
4
Figure 2.1. Trends in nutrient concentrations (inorganic N and total P) in the
Danube River (2000-2003)
Data source: Trans-National Monitoring Network database
Figure 2.2.
Nutrient and BOD5 content of livestock manure in the Black Sea sub-
basins2 of Romania (top) and Bulgaria (below), 1960-2003
) 600,000
120,000
3,000,000
e
)
e
)
n
n
e
n 400,000
n 80,000
n 2,000,000
n
(to
(to
t
o
(
l N 200,000
40,000
l P
5 1,000,000
ta
ta
D
o
o
T
0
0
T
BO
0
1960 1970 1988 1997 2003
1960 1970 1988 1997 2003
1960 1970 1988 1997 2003
.
) 80,000
60,000
240,000
)
ne
e
)
n
e
n
180,000
n
t
on
n
40,000
30,000
(to
o 120,000
l N (
(t
a
l P
5
t
60,000
ta
D
oT
0
o
0
T
BO
0
1960 1970 1988 1997 2003
1960 1970 1988 1997 2003
1960 1970 1988 1997 2003
Data source: Dumitru, M. (2005) Romanian livestock assessment; Petkova, E. (2005) Livestock numbers
and potential nutrient/organic loads to the Black Sea from riparian countries. National report Bulgaria.
Both reports prepared under BSERP, Phase 2.
2 Land draining either directly into the Black Sea or into the Black Sea via the Danube
5
3.
Danube loads to the Black Sea
Danube loads to the Black Sea are calculated from flow and concentration data measured
at Reni, approx 30-40 km upstream of the Danube Delta (Fig. 3.1). Data from 200-2003
are officially endorsed by the ICPDR, while pre-2000 and post 2003 date are unofficial,
albeit monitored at the same site.
From these data it appears that there have not been substantial reductions in Danube-
derived nutrient or BOD5 loads to the Black Sea during the last decade. Indeed, the total
phosphorus load during 2005 (a high flow year) compared to previous years. The increase
was proportionally much greater than for ortho-phosphate, suggesting that it could largely
be explained by an increase in particulate phosphorus, concomitant with elevated
suspended solids levels/discharges (data not shown). It is interesting to note that the
ortho-phosphate and BOD5 load plots follow similar patterns, suggesting that both of
these loads are derived primarily from the same "animal" source.
Figure 3.1.
Danube River annual nutrient/BOD5 loads and flows to the Black Sea
(1996-2005)
0
60
12000
15
12000
)
a
)
)
t/3
/s
3 /s
3
10
/a)
m
(
3 t
(
m
10
0
40
8000
ad 10
8000
(
l
o
w
l
ow (
l
o
ad
e f
P
e
f
e-
g
lo
ag
N
at
r
a
e-
v
e
0
20
4000
aver
s
p
h
5
4000
i
t
r
at
u
al
h
o
a
l
a
N
-
p
u
n
n
n
A
n
r
t
h
o
A
O
0
0
0
0
1996
1997
1998
1999
2000
2001
2002
2003
2004
2005
1996
1997
1998
1999
2000
2001
2002
2003
2004
2005
45
12000
900
12000
)
)
/s3
/s
3
m
)
m
(
(
/a
w
)
w
t3
30
8000
l
o
a 600
8000
t/
3
l
o
10
e
f
0
(
e f
g
1
d
r
a
(
ag
loa
ad
er
v
e
l P 15
4000
l
o 300
4000
a
l
a
5
t
a
a
l
av
D
o
u
T
nnu
n
A
BO
An
0
0
0
0
8
9
0
4
5
96
97
9
9
0
01
02
03
0
0
96
97
98
99
00
01
02
03
04
05
19
19
19
19
20
20
20
20
20
20
19
19
19
19
20
20
20
20
20
20
Data source: Trans-National Monitoring Network database; Romanian Waters National Administration.
Plot provided by Dr M. Zessner, Institute for Water Quality, Technical University of Vienna.
Temperature, reflecting seasonality, is also an influencing factor on nitrogen loads to the
Black Sea (Fig. 3.2), with an overall decrease in medium-high flow-related loads during
2003-2005 compared to 1996-1998 (Figure 3.3). When both temperature and flow are
accounted for, the beginnings of a decrease in inorganic nitrogen loads during 2003-2005
is apparent (Fig. 3.4), suggesting that the upstream trend of decreasing inorganic nitrogen
concentrations during 2000-2003 (Fig. 2.1) is beginning to follow-through to a reduction
in recent loads to the Black Sea (2003-2005).
6
For total phosphorus, as with nitrate, during 2003-5 there was a tendency towards lower
instream loads during high flow events, but at moderate flows, loads appear to have
increased when compared to the 1996-1998 situation. However, then the influence of
river flow is removed from loads, the large increase in the 2005 load at Reni (see Fig.
3.1) is effectively removed (Figure 3.6), revealing no apparent trend over the 1996-2005
period.
Figure 3.2. Inorganic nitrogen load/temperature relationships at Reni during
1996-1998 and 2003-2005
5
2004-2005
4.5
1996-1998
4
Trend 1996 - 1998
3.5
Trend 2004-2005
3
/
l
)
g 2.5
(m
R2 = 0.43
N
TI
2
R2 = 0.52
1.5
1
0.5
0
0
5
10
15
20
25
30
T (°C)
Data source: 1996-998 Trans-National Monitoring Network database; 2004-2005 Romanian Waters
National Administration. Plot provided by Dr M Zessner, Institute for Water Quality, Technical University
of Vienna.
Figure 3.3. Inorganic nitrogen load/instantaneous flow relationships at Reni
during 1996-1998 and 2003-2005
3000
2004-2005
2500
1996-1998
Trend 2004-2005
R2 = 0.66
2000
Trend 1996-1998
t
/
d)
R2 = 0.63
( 1500
N
TI
1000
500
0
0
2000
4000
6000
8000
10000
12000
14000
16000
Q (m3/s)
Data sources: 1996-1998 Trans-National Monitoring Network database; 2004-2005 Romanian Waters
National Administration. Plot provided by Dr M. Zessner, Institute for Water Quality, Technical University
of Vienna.
7
Figure 3.4.
Inorganic nitrogen loads at Reni (1996-2005), accounting for flow and
temperature
600
12000
500
10000
400
8000
a
)
t/3
0
/s)3
(1 300
6000
m
a
d
(
-
lo
MQ
I
N
T 200
TIN-load - ICPDR mehtod
4000
TIN-load, influence of Q calculative eliminated
100
2000
TIN-load, influence of Q and T calculative eliminated
Mean flow of the year
0
0
1996
1997
1998
1999
2000
2001
2002
2003
2004
2005
Data source: Trans-National Monitoring Network database; Romanian Waters National Administration.
Plot provided by Dr M. Zessner, Institute for Water Quality, Technical University of Vienna.
Figure 3.5. Total phosphorus load/instantaneous flow relationships at Reni
during 1996-1998 and 2003-2005
120
2004-2005
100
1996-1998
trend 2004-2005
80
Trend 1996-1997
)
t
/
d
60
-
P (
4
PO
40
R2 = 0.13
20
R2 = 0.37
0
0
2000
4000
6000
8000
10000
12000
14000
16000
Q (m3/s)
Data source: 1996-1998 Trans-National Monitoring Network database; 2003-2005 Romanian Waters
National Administration. Plot provided by Dr. M. Zessner, Institute for Water Quality, Technical
University of Vienna.
Figure 3.6.
Total phosphorus loads at Reni (1996-2005), accounting for flow
45
12000
40
10000
35
30
)
8000
t/a
)
3
25
/s
1
0
3 m
d (
6000
20
l
oa
MQ (
TP- 15
4000
10
TP-load, ICPDR method
2000
5
TP-load, influence of high flow events excluded
mean flow of the year
0
0
1996
1997
1998
1999
2000
2001
2002
2003
2004
2005
Data source: Trans-National Monitoring Network database; Romanian Waters National Administration.
Plot provided by Dr M. Zessner. Institute for Water Quality, Technical University of Vienna.
8
Over a longer period (1988-2005) the picture that emerges is of increasing inorganic
nitrogen loads and decreasing total P loads (Fig. 3.7). However if account is taken of
flows, there is actually a slight decrease in organic nitrogen loads and a much larger
decrease in phosphorus loads (Fig. 3.8). It is clear from Figs. 3.7 and 3.8 that annual
nutrient loads need to be reduced by a factor of 1.5-3 to reach the levels measured prior to
1960.
Figure 3.7. Danube River annual nutrient loads and flows to the Black Sea (1988-
2005)
1000
10000
100
10000
800
8000
80
8000
)
y
)
/s
600
6000
)
3
y
)
60
6000
/s
m
3
(
(
k
t/
k
t
/
(
m
l
P
400
4000
ta
40
4000
Flow
To
Flow
DIN (
200
2000
20
2000
0
0
0
0
88
89
90
91
92
93
94
95
96
97
98
99
00
01
02
03
04
05
1
959
1
988
1
989
1
990
1
991
1
992
1
993
1
994
1
995
1
996
1
997
1
998
1
999
2
000
2
001
2
002
2
003
2
004
2
005
19
19
19
19
19
19
19
19
19
19
19
20
20
20
20
20
20
8-
DIN kt/y TNMN/Buch.Decl.
-
1
9
5
9
19
DIN kt/y Almazow
194
P kt/y TNMN/Buch.Decl.
P kt/y Almazow
Danube discharge m3
1948
linear trend
Danube discharge m3
linear trend
Data source: Trans-National Monitoring Network database; Romanian Waters National Administration;.
Plots provided by Dr J. van Gils, WL delft hydraulics, Delft, The Netherlands.
Figure 3.8.
River Danube annual inorganic nitrogen and total phosphorus loads
(corrected for annual discharge) to the Black Sea (1989-2005)
800
80
600
60
)
)
y
y
t/
t/
(k
(k 400
40
I
N
l
P
D
ta
o
T
200
20
0
0
9
8
9
0
1
2
3
4
5
6
7
8
9
0
1
2
3
4
5
5
9
88
89
9
0
9
1
92
93
96
97
9
8
99
00
01
04
0
5
198
198
199
199
199
199
199
199
199
199
199
199
200
200
200
200
200
200
-19
19
19
19
19
19
19
1
994
1
995
19
19
19
19
20
20
2
002
2
003
20
20
-195
1
948
DIN (Q corr.) kt/y
DIN kt/y Almazow
1
948
Total P (Q corr.) kt/y
Total P kt/y Almazow
linear trend
Data source: Trans-National Monitoring Network database; Romanian Waters National Administration.
Plot provided by Dr J.van Gils, WL delft hydraulics, Delft, The Netherlands and Dr. M. Zessner, Institute
for Water Quality, Technical University of Vienna.
4.
Danube flow/concentration relationships
Annual flows in the Danube show clear seasonality, with highest flows in spring.
Concentration data for 2000-2005 are plotted against flow (Fig. 4.1). Nutrients and BOD5
showed only very weak correlations with instantaneous flow, albeit that the overall
relationships were slightly positive for nutrients. Nevertheless, this is not surprising,
considering the lack of seasonality shown by all of the parameters, except for nitrate (Fig.
4.2).
9
Thus, while higher annual flows tend to results in higher loads of nutrients (nitrate and
total P; Fig. 3.1), it is only concentrations of nitrate that may substantially increase at
higher instantaneous flows (Fig.4.2). This is a surprising conclusion for total P, especially
considering the high annual total P load for 2005, corresponding to high annual flows
Figure 4.1.
Time series of nutrient and BOD5 concentrations at Reni (2000-2005)
16000
4
16000
5
.
.
l)
)
)
/s 12000
3 g/
4
/s 12000
3
m
3
g/l)
m
(
m
3 m
( 8000
2 -N
(
(
8000
t
e
w
l N
a
o
2
t
a
Flow 4000
1 itr
Fl 4000
o
N
1 T
0
0
0
0
00
01
02
03
04
05
06
00
01
02
03
04
05
06
1/
1/
1/
1/
1/
1/
1/
1/
1/
1/
1/
1/
1/
1/
1/
1/
1/
1/
1/
1/
1/
1/
1/
1/
1/
1/
1/
1/
16000
0.2
16000
0.4
.
.
g/l)
)
)
12000
m
/s
12000
/s
3
3
m
-
P (
m
( 8000
0.1
(
(mg/l)
t
e
8000
0.2
w
a
w
l
P
o
o
Fl 4000
ph
Fl 4000
os
Tota
h
0
0
P
0
0
0
0
0
1
0
2
0
3
0
4
0
5
0
6
0
0
0
1
0
2
0
3
0
4
0
5
0
6
1/
1/
1/
1/
1/
1/
1/
1/
1/
1/
1/
1/
1/
1/
1/
1/
1/
1/
1/
1/
1/
1/
1/
1/
1/
1/
1/
1/
16000
6
.
)
2
1 000
/l)
/s3
4 g
m
m
8000
(
5
ow (
2
Fl 4000
BOD
0
0
0
0
0
1
0
2
0
3
0
4
0
5
0
6
1/
1/
1/
1/
1/
1/
1/
1/
1/
1/
1/
1/
1/
1/
Data source: Dr M. David, Romanian Waters National Administration
(Figs. 3.1 and 3.2), but could be a reflection of the relative contributions of point and
diffuse source-derived phosphorus to instream loads at high and low flows. However, for
nitrate the situation is more complex than such simple statements suggest, since peak
concentrations often do not occur at the same time as annual peak flows (Fig. 4.1)
thereby weakening the instantaneous flow/concentration relationship (Fig. 4.2).
10
Figure 4.2.
Danube flow-concentration relationships for nutrients and BOD5 at
Reni (2000-2005)
4
6
/
l)
g
/l)
g
4
(
m
m
2
(
-
N
t
e
l N
2
t
a
i
t
r
a
o
N
0
T
0
0
5000
10000
15000
0
5000
10000
15000
Flow (m3/s)
Flow (m3/s)
0.2
0.5
t
e
a
/l)
0.4
h
g
p
/l)
g
m
0.3
0.1
os
(
m
0.2
ph
(
l
P
P
o-
t
a
0.1
o
0
T
r
t
h
0
O
0
5000
10000
15000
0
5000
10000
15000
Flow (m3/s)
Flow (m3/s)
6
/l)
4
g
m
(5
2
D
BO
0
0
5000
10000
15000
Flow (m3/s)
Data source: Dr M. David, Romanian Waters National Administration
5.
Nutrient concentrations in NW Shelf waters
Annual average nutrient concentrations at Constanta are shown in Fig .5.1. This show a
clear trend of decreasing phosphate concentrations throughout the 1990s, with much
lower concentrations maintained through the early 2000s. The situation with nitrate is
rather different with high concentrations which occurred in the late 1970s being
maintained at substantially lower levels during the 1980s, 1990s and into the 2000s,
albeit with an increase again in 2005, corresponding to elevated Danube flows (Figs. 3.1
and 3.2).
Fig. 5.2 illustrates the problems encountered when trying to amalgamate long-term data
from a range of coastal water sites, rather than using data from a single site. Here,
available data from all Romanian coastal water sites, sampled at depths shallower than
50m is shown. The overall impression is of decreasing phosphate levels and increasing
nitrate levels (as would be inferred from Fig. 5.1, over the same time period), but with
much greater inter-annual variability.
11
Figure 5.1.
Annual average nutrient concentrations in surface waters near
Constanta, Romania (1975-2005)
25
14
12
20
l
/
l
)
l
/
l
)
o
o
10
m
m
µ
µ 15
( 8
e
e (
6
at 10
itrN
4
osphat
5
h
P 2
0
0
5
0
85
90
1975
1980
1985
1990
1995
2000
2005
995
000
197
198
19
19
1
2
2005
Data source: Dr A. Cociasu, National Institute for Marine Research and Development, Constanta, Romania
Figure 5.2. Amalgamated nutrient concentration data from the Romanian part of
the Black Sea (1990-2004)
10
2
l
/
l
)
o
/l)
m
l
(
µ
om
t
e
a
(µ
h
N
5
1
s
p
e-at
itr
pho
N
r
t
ho-
O
0
0
90
92
94
96
98
00
02
04
90
9
2
9
4
96
9
8
00
02
0
4
19
19
19
19
19
20
20
20
19
19
19
19
19
20
20
20
Data source: National Institute for Marine Research and Development, Constanta, Romania; BSERP
database
6.
Phytoplankton populations in NW Shelf waters
Phytoplankton data can be considered both in terms of major taxonomic groups and in
terms of cell density and biomass-related factors. Of the latter two, biomass is the more
important indicator, because of the large variability in size between different species and
the fact that phytoplankton community composition changes on a seasonal basis.
Biomass is estimated from cell volume (biovolume) measurements. Chlorophyll-a is a
pigment present in all photosynthetic phytoplankton, typically comprising 1-2% of dry
weight, that is used as a surrogate of biomass. Remote sensing (satellite imagery) data
can be used to monitor chlorophyll-like substances in large waterbodies, and this also is
used as a surrogate of phytoplankton biomass. However, because different taxonomic
groups also contain a mix of other types of chlorophyll (-b and c) and additional
photosynthetic pigments, even though the remote sensing images are calibrated against
measured chlorophyll-a concentrations, there is some margin of error. Thus, the images
can over- or under-estimate actual data, depending on what species are present, at
different times of the year and in different areas of the sea. Remote sensing images are,
therefore, a less reliable indicator of phytoplankton biomass than chlorophyll-a
measurements.
12
6.1
Abundance and biomass
Phytoplankton cell density and biomass have shown considerable inter-annual variability
over the last two decades (Fig. 6.1). In 2001, when a temporary return of hypoxic
conditions was observed an increase in cell density occurred equivalent to that observed
in the 1980s. However, when longer-term averages are considered, an emerging pattern
of reducing plankton biomass can be seen, albeit with average levels observed in the last
3 years (2003-2005) at Constanta being typical of those occurring in the 1960s (see Fig.
6.2). Results from Cape Galata, while not as promising as those from Constanta, still
show a trend in the right direction, with average phytoplankton biomass levels during
1998-2005 being nearly half of those measured during the 1980s.
Figure 6.1.
Phytoplankton cell density and biomass (average annual data)
offshore of Constanta, Romania (1983-2005)
Data source: Dr A. Cociasu, National Institute for Marine Research and Development, Constanta, Romania
Figure 6.2. Long-term (1960s-2000s) average phytoplankton biomass: (A) annual
average data offshore of Constanta, Romania and (B) annual
September values from three nautical miles offshore of Cape Galata,
Bulgaria
9
9
(A)
(B)
)
)
3
3
m
/m 6
6
g/
m
s (
a
s
s
(g
m
as
3
i
o
3
B
i
om
B
0
0
s
3-
0
1-
0
1-
5
-
3
-
0
-
7
-
5
1960
198
199
199
200
200
200
1961
196
1983
199
1995
199
1998
200
Data source: (A) Dr L. Boicenco, National Institute for Marine Research and Development, Constanta,
Romania; (B) Dr S. Moncheva, Institute of Oceanology Bulgarian Academy of Science, Varna, Bulgaria.
6.2 Community
composition
The ratio between major phytoplankton taxonomic groups can also be used as an
indicator of ecosystem status. As with phytoplankton biomass/abundance data there is
considerable inter-annual variability. Nevertheless, grouping data from longer periods of
time together, once again indicates that recovery is once again taking place (Fig. 6.3).
13
Unfortunately, taxonomic data are not available from the 1960s reference period, but it is
clear that in terms of the contribution of major taxonomic groups to total phytoplankton
biomass, at least, the situation in recent years has returned to a situation resembling that
in the 1980s. Post-2000, the situation with regard to cell counts has been rather less
straightforward, since the temporary return of eutrophic conditions in 2001 was reflected
very severely in the phytoplankton population, with almost 100% of phytoplankton cell
counts in the following year consisting of "other" groups (data not shown).
Figure 6.3.
Phytoplankton community composition near Constanta, Romania
(1986-2005)
100%
100%
80%
80%
60%
60%
40%
40%
20%
20%
0%
0%
6-
1-
1-
86-
90
91-
00
01-
05
90
00
05
19
19
19
20
20
20
198
19
199
20
200
20
Other groups density
Other groups biomass
Dinoflagellate density
Dinoflagellate biomass
Diatom density
Diatom biomass
Data source: Dr L. Boicenco, National Institute for Marine Research and Development, Constanta,
Romania
6.3 Chlorophyll-like
substances
Figure 6.4 shows remote-sensing images of the Black Sea, obtained using Seawifs
satellite data. Although there is considerable monthly and yearly variability in the data,
high chlorophyll levels were clearly evident in 2001, notably during the period May to
September, confirming the temporary return of eutrophic conditions at this time.
However, during 2003, levels of chlorophyll-like substances appeared to be very low,
particularly along the NW coastline where the Danube discharges into the Sea. Overall,
there appears to have been lower chlorophyll levels in the Black Sea since 2001 than in
previous years. November 2004 is particularly noticeable because of the dominance of
blue colours, indicating considerably reduced chlorophyll levels (and therefore
phytoplankton biomass) compared to the same month in previous years.
14
Figure 6.4.
Chlorophyll-like substances in the Black Sea (1997-2005)
Januar
y
Marc
h
May
Jul
y
Septembe
r
November
1997
1998
1999
2000
2001
15
Figure 6.4
Continued...
Januar
y
March
May
Jul
y
Septembe
r
November
2002
2003
2004
2005
Data source: http://marine.jrc.cec.eu.int/frames/archive_seawifs.htm
16
7. Zooplankton
Microzooplankton in the Black Sea are dominated by Cladocera and Copepoda, long-
term data for which present a fascinating reflection of the biological changes that have
occurred since the 1960s. Fig. 7.1 shows a clear long-term trend of declining abundance,
with extrapolation of the long-term linear regression line suggesting that in 2006,
zooplankton abundance would be a full order of magnitude lower than that in 1967.
However, there is a great deal of inter-annual variability in the figures, and when only
more recent data are considered (e.g. a trend line for data from 1997-2005 is shown in Fig
7.1), these suggest that zooplankton abundance has actually levelled off or increased over
the last decade.
Figure 7.1
Long-term summer abundance of Cladocera and Copepoda three
nautical miles offshore of Cape Galata, Bulgaria (1967-2005)
5
r
/
l
)
be
4
num
e
(
nc
nda 3
1967-2005 data set
u
b
1997-2005 data set
a
Linear (1967-2005 data set)
g10
lo
Linear (1997-2005 data set)
2
966
972
980
986
996
002
1
1
1
1
1
2
Data source: 1967-1994, Prof. A. Konsulov, 1994-2002, Dr. L. Kamburska; 2003-2005, Dr K Stefanova,
IO-BAS. All data provided by Dr Stefanova, Institute of Oceanology Bulgarian Academy of Sciences,
Varna.
8.
Zoobenthos populations of the NW Shelf
The status of zoobenthos (sediment invertebrates) communities can be assessed using a
range of reporting metrics:
· Abundance (the total number of all species per m2 of sediment)
· Biomass (the total number of individual invertebrates (of all species) per m2 of
sediment
· Number of species present (the total number of species present at any one site)
· Zoobenthos indices
Sampled were collected during one of the Phase I BSERP research cruises (2003), and it
is intended to re-sample these sites in the Phase II cruises during 2006 for comparative
purposes to see whether/how the situation has changed
17
8.1
Abundance and biomass
A large area of increased abundance/biomass was present in front of the Danube delta
and Constanta (Romania), with decreased abundance in front of Odessa (Ukraine) -
possibly due to contamination by pesticides and at more southerly Bulgarian sites.
Abundance/biomass clearly decreases offshore. The pattern of decreasing
abundance/biomass in southerly waters is due to the reduced influence of major rivers
(the Danube and Dniester) which provide an import source of nutrients and organic
carbon which are cycled through the food chain.
8.2 Species
diversity
The higher species richness in shallower waters (Fig. 8.1) is associated with good
dissolved oxygen conditions. The observed lower diversity in deeper areas was fully
expected due to natural oxygen depletion with increasing depth in the Black Sea. (e.g.
Fig. 8.1). In the shallow Danube delta and Odessa areas low benthic diversity is
preconditioned by the highest content of silt/clay fraction in sediments and aggravated by
the decreased oxygen concentration associated with anthropogenic eutrophication. The
effect of toxic substances may also play a role in the Odessa area (data not shown).
While the 2003 data provide a good snapshot of zoobenthos biodiversity, an example of
trends in biodiversity is given in Fig 8.2. Here, the improving situation can be seen
clearly the number of species has doubled since the mid-1990s, albeit with some way to
go before the "reference" situation of the1960s can be re-established.
8.3 Zoobenthos
indices
A range of zoobenthos indices exist for report purposes. Fig 8.3 shows results for the NW
Shelf using the AZTI Marine Biotic Index (AMBI) one which provides rather
optimistic results compared to other zoobenthos indices:
· The Bulgarian coastal area is distinguished by good, occasionally high zoobenthic
status.
· The Danube plume area is characterised by moderate to poor zoobenthic status,
although improving status is evident in more southerly Romanian wasters (with
increasing distance from the Danube).
· The Dniester area coastal stations are moderately disturbed with an improving
situation offshore.
· The AMBI results for most Odessa area stations (only slightly disturbed)
contradict those of other zoobenthic indicators (lowest abundance of crustaceans,
lowest species richness, absence of adult molluscs, etc.).
· Deep area stations are generally considered to be undisturbed.
18
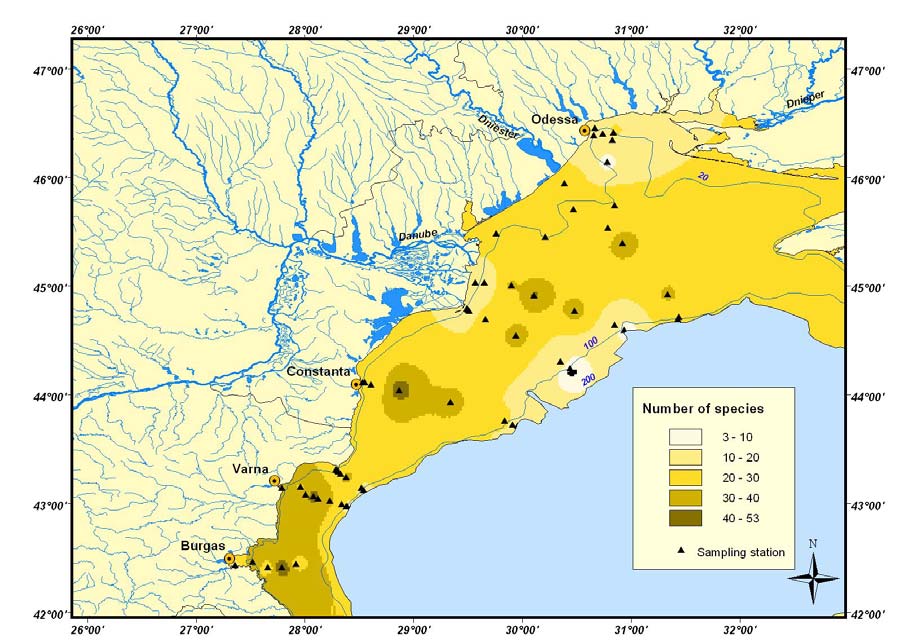
Figure 8.1.
Macrozoobenthic species distribution in the NW Shelf (2003)
Data source: Todorova, V and Konsulova, T., IO-BAS (2006) Ecological state assessment of zoobenthic
communities on the North-Western Black Sea Shelf the performance of multivariate and univariate
approaches. Presentation made at the Black Sea Scientific Conference, 8-10 May 2006, Istanbul.
Figure 8.2.
Number of macrozoobenthos species near Constanta, Romania
(1960s-2003)
60
a
x
a
40
f
T
e
r
o
b 20
m
u
N
0
60s
19
1
988
1
996
1
998
1
999
2
000
2
001
2
002
2
003
Data source: Dr C. Dumitrache, National Institute for Marine Research and Development, Constanta,
Romania
19


Figure 8.3.
AZTI marine biotic index results - geographic distribution (2003)
Data source: Todorova, V and Konsulova, T. (2006) Ecological state assessment of zoobenthic
communities on the North-Western Black Sea Shelf the performance of multivariate and univariate
approaches. Presentation made at the Black Sea Scientific Conference, 8-10 May 2006, Istanbul
9.
Dissolved oxygen status of NW Shelf waters
Between the early 1970s and early-mid 1980s, the area of the NW shelf affected by low
dissolved oxygen conditions (hypoxia) increased in size (data not shown). However, by
the mid 1990s the situation was beginning to recover and had improved further by 1999
(Fig. 9.1).
A return of hypoxic conditions in 2001 was clearly recorded in mussel population age
structure statistics (mussels form annual growth rings, similar to trees). Thus, samples
collected from coastal waters between the Danube delta and Odessa (Ukraine) regions (at
25 m depth) during 2003 contained very few older (>2 years) mussels, since these has
died during the 2001 event (data not shown).
Fig. 9.1 reveals that while DO levels fell substantially in Romanian coastal during
summer 2001, the overall trend since 1996 has been one of improving status. A transient
hypoxic event occurred close to Constanta in summer, 2005, resulting in a fishkill. While,
the affected area appears to have been highly localized within Romanian coastal waters, a
hypoxic event was also reported in the Ukrainian part of the NW Shelf during summer of
the same year.
20
Dissolved oxygen measurements taken just above the sediment should be one of the best
indicators of trophic status. However, robust data are very expensive to collect. In reality,
such monitoring needs to be continuous (e.g. measurements taken every 30 minutes to
account for diurnal fluctuations in dissolved oxygen levels), with very good spatial
resolution. Manual monitoring is, therefore, not pragmatic. Thus, a network of buoy-
mounted sondes/probes is required to produce robust data, with regular (perhaps
fortnightly) servicing/re-calibration of the instruments, rather than the series of snapshot
values illustrated in Fig. 9.1. Clearly this is not possible, given the current financial
restraints. A single day of hypoxia will strongly affect zoobenthos populations for years
in the future.
Figure 9.1.
Dissolved oxygen content of Romanian coastal waters (1996-2004)
Oxygen saturation at bottom of WBS
station Sf. Georghe
160
140
120
100
80
60
40
O
distance to coast: 6km
x
y
distance to coast: 18km
g
20
e
distance to coast: 30km
n
s
a
0
tu
r
a
t
i
o
1996
1997
1998
1999
2000
2001
2002
2003
2004
2005
n
[%
]
Oxygen saturation at bottom of WBS
station Zaton
160
140
120
100
80
60
40
distance to coast: 10km
O
distance to coast: 14km
x
y
distance to coast: 24km
gen
20
distance to coast: 32km
sa
0
t
u
r
a
ti
on
1996
1997
1998
1999
2000
2001
2002
2003
2004
2005
[
%
]
Oxygen saturation at bottom of WBS
station Constanta
140
120
100
80
60
distance to coast: 2km
40
distance to coast: 12km
O
distance to coast: 22km
xyg
20
distance to coast: 46km
distance to coast: 70km
e
n
sa
0
t
u
r
a
t
i
o
1996
1997
1998
1999
2000
2001
2002
2003
2004
2005
n
[
%
Data source:
]
Cociasu et al. (2003-2005) Deliverables: D7.1 Romanian report; D7.3 Romanian annual
reports 2001-2002; and D7.6 "Summary report on field and laboratory work in 2001-2003 in comparison
with previous observations in the Western Black Sea" from the project "Nutrient Management in the
Danube Basin and its impact on the Black Sea" supported under contract EVK1-CT-2000-000 of the 5th EU
Framework Programme, http://danubs.tuwien.ac.at
21
10. Discussion
10.1
Nutrient loads and levels
As discussed in Section 5, there is a paucity of data to illustrate trends in nutrient
concentrations within the NW shelf as a whole, though there is one particularly useful
dataset from Romanian waters, albeit likely to be influenced to a large extent by changing
local nutrient loads from land. NIMRD data (not shown) suggest a major decrease in
nutrient levels at Sulina, close to where the Danube discharges into the Black Sea, but
this is a coastal site which again is likely to reflect changes in local nutrient discharges
from land. The extent of the decrease in nutrient levels at this site certainly cannot be
explained by the relatively small decreases in Danube loads observed at Reni, particularly
with regard to nitrate, since about half of the flow in the Danube is groundwaterderived,
with available groundwater nitrate data (not shown) failing to show a major decrease in
concentration.
Fixed nitrogen (organic and inorganic) applied to land as fertiliser (including livestock
manure) is more rapidly exported to rivers/sea in surface runoff than via groundwater.
(Groundwater is a relatively unimportant supply route of phosphorus to surface waters.)
So, in the years following the economic collapse of the late-80s-early 90s when regional
livestock numbers and inorganic fertiliser sales rapidly declined, it is possible that
nutrient loads to the sea via surface water runoff/soil erosion) did decline substantially,
but data to support, such a theory is mixed. Certainly, data from Reni show flow-
corrected inorganic nitrogen loads from the Danube hardly to have changed since 1988;
but the trend in total phosphorus loads is very different, illustrating an obvious decrease
since 1998, and with a particularly rapid fall in 1992/1993 compared to previous years.
Much greater success has been achieved with reducing phosphorus than inorganic
nitrogen loads to the Black Sea. This success appears primarily to have been the result of
reducing phosphate loads to land as both inorganic fertiliser and as livestock manure.
However, in many countries a shift away from intensive livestock units to more extensive
livestock production techniques has almost certainly contributed to the long-term trend.
10.2
Ecology, organic carbon and oxygen balance
The microzooplankton results (Section 7) suggest that a huge change in Black Sea
ecology has occurred since the late 1960s, and it would be almost impossible to argue
otherwise. However, the trend is in the opposite direction to that which would be
expected if eutrophication was the only environmental problem, since higher nutrient
levels typically result in higher abundance and biomass of phytoplankton, zooplankton
and higher predators; not a 10-fold decrease, as Fig. 7.1 could suggest. Clearly, then, the
zooplankton results need to be viewed in the light of wider environmental issues:
The phytoplankton results (Section 6) are very interesting. Biomass levels have been on
a downwards trend since the worst eutrophic period of the 1980s, as would be expected if
nutrient levels within the Sea had fallen. Supporting evidence for the downwards trend in
phytoplankton biomass levels in the whole of the Black Sea (not just two sites, relatively
close to land) is provided by remote sensing images (Fig. 6.4).
22
Recent unpublished data from the BSERP July/Sept 2006 research cruise suggests that
along a transect within 15-20 miles of the Dniester River mouth, organic loading and
inefficient cycling of organic matter still allow hypoxic conditions to occur. This cruise
also found Noctiluca3, a heterotrophic phytoplankter to be present in large densities at the
outer edge of influence of the Danube inflow. Noctiluca is recognized as an indicator of
eutrophic conditions in the Black Sea, and a gradual shift towards non-photosynthetic
phytoplankton (Noctiluca and other taxa) could help explain, in part at least, the observed
trend of decreasing chlorophyll levels. Fig 6.3, while not including data for the 1960s,
still demonstrates the huge changes that have taken place in major phytoplankton
taxonomic groups, since the phytoplankton community during this period was dominated
completely by dinoflagellates and diatoms.
Over-fishing is still considered one of the most important environmental problems facing
the Black Sea. It doesn't matter whether a relative reduction in the abundance/biomass of
top-level predators (e.g. horse mackerel) or lower level consumers is the consequence,
the result is reduced grazing pressure on zooplankton, and therefore an increase in
grazing pressure on phytoplankton. Fig. 6.4, showing a trend of decreasing levels of
chlorophyll-like substance, supports the theory that zooplankton grazing pressure has
increased since 1997. However changing chlorophyll levels can also be interpreted in
another way: that zooplankton levels mirror the "carrying capacity" of the sea for
phytoplankton, so reducing chlorophyll levels (as an indicator of phytoplankton biomass)
would be expected to result in lower zooplankton biomass. Unfortunately,
microzooplankton biomass data are not available, only abundance data.
Mnemiopsis leidyi. This fast-reproducing comb jelly was first identified in the Black Sea
during the early 1980s and its impact on native biota and fisheries has been devastating.
By the mid 1990s, estimates of its total biomass in the Black Sea and Sea of Azov
approached 1 billion tonnes. Mnemiopsis actively feeds on fish larvae and zooplankton,
but only passively on phytoplankton. The issue here is the relative feeding pressure
Mnemiopsis exerts on fish larvae compared to zooplankton, which is not fully
understood. Certainly the downwards trend in cladocerans and copepods (Fig. 7.1) started
a long time before Mnemiopsis was first identified in the Sea. Now that a major predator
of Mnemiopsis (another invasive comb jelly, Beroe ovata) is abundant in the Black Sea,
increasing in numbers since the mid-1990s, this could have helped microzooplankton
populations to recover to higher levels than those observed in the 1990s.
The overall picture that emerges of ecology is one of recovery. However, the presence of
alien species may have had a greater and more long-term impact than previously thought.
There is evidence of a new "type" of ecosystem having established in the NW Shelf at
least, leading some experts to consider that a full return to 1960s ecological conditions
may prove to be even more challenging than originally thought, despite further planned
reductions in nutrient loads.
3 Noctiluca enumeration is undertaken as part of microzooplankton monitoring, because of the relatively
large size of this dinoflagellate genus (typically 400-600 µm).
23
Document Outline